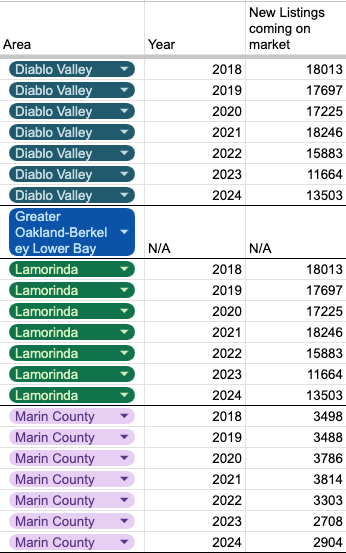
New Listings by Area
The client worked in real estate, and wanted to determine how many new listings they could expect. We were given reports by an independent housing statistics agency and told to extract whatever insights we could find.
Splitting Up the Data
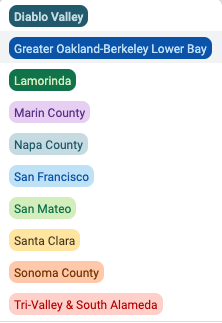
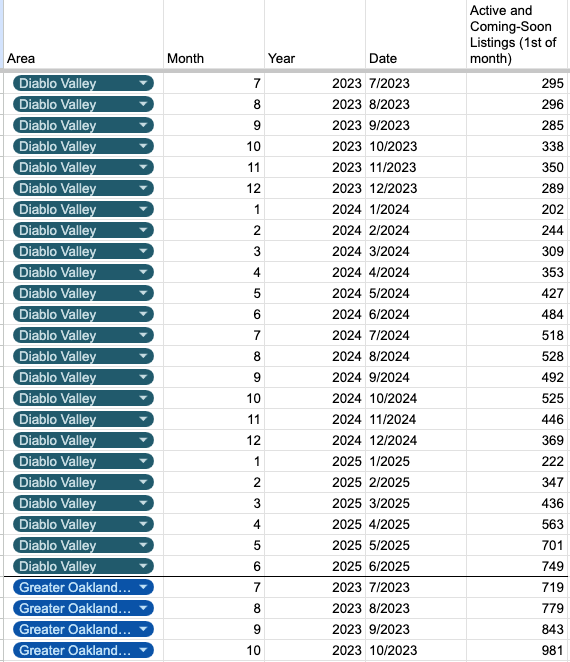
One of the most prevalent problems when inputting strings of text is the persistent threat of making a typo, which can disrupt proper insight collection and visualization. In larger datasets, typos can be almost impossible to find. Because we were inputting this data from a separate report, we wanted to avoid typos and make inputting easier for ourselves.
After testing a few options, we created a drop-down menu with all the categories in the data. Adding color-coding to the dropdown menu also allowed for a better understanding of which data had already been put in.
Creating Graphs
Once we input all the data, it was time to make it into a visualization.
I used average values for all variables because a simple sum would be much more confusing for the client and increased the risk of disproportionate values.
Because many of the values were similar, they could easily be mistaken or confused. We used an inbuilt function to display the precise numbers in the data to avoid this problem.
Adding More Data
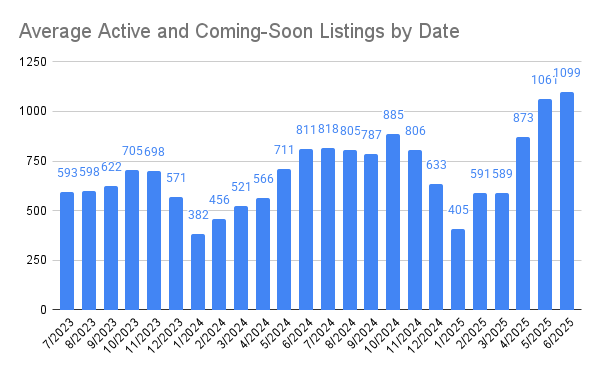
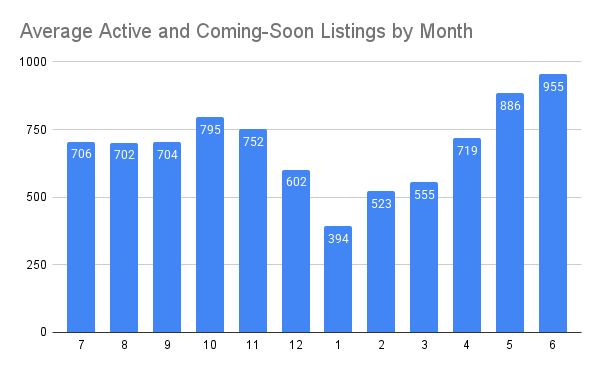
After adding a year and a half of data and making the first visualizations, we realized we wanted to see how listings changed per month. We went back to the original report and added enough data to have a full two years worth, making the average values more precise as well.
The monthly data showed a clear increase during summer and autumn, with a sharp decrease in winter, showing a clear seasonality with listings.
Final Outcome
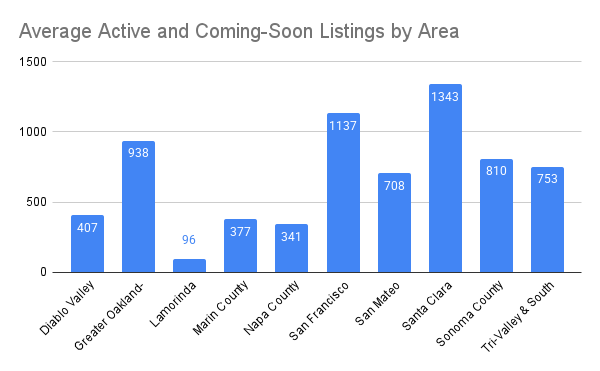
The client had assumed that San Francisco would have been the best place to find new listings because of its reputation as a big city. Contrary to expectations, we found that another region that the client had not considered had more listings and would be better to expand into.
The other data was more in line with standard expectations, but the client still appreciated having solid data to make decisions with.